UPCOMING EVENTS
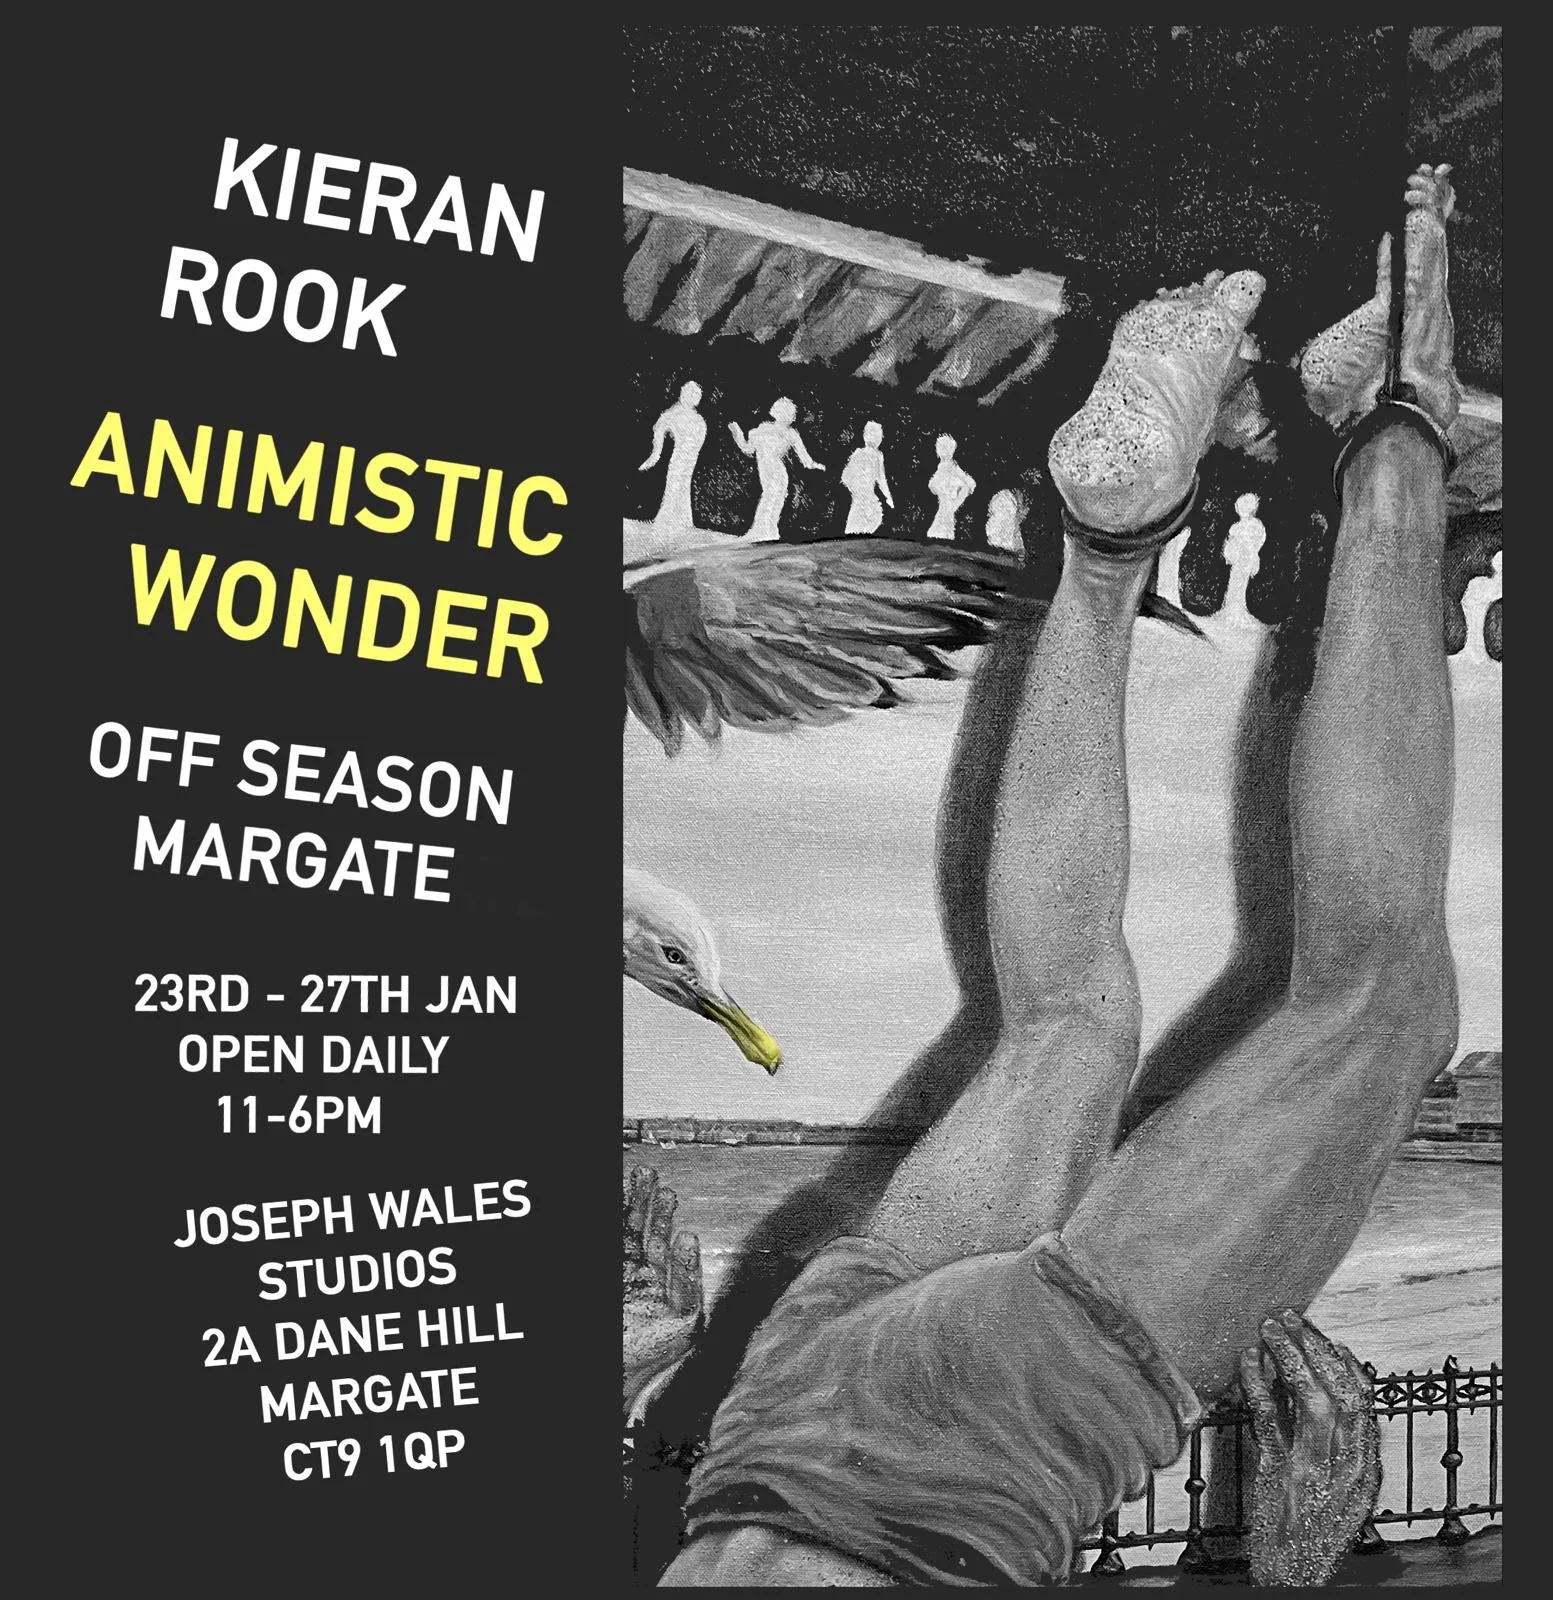
ANIMISTIC WONDER
23rd January - 27th January 2026
Kieran Rook presents his solo show ‘Animistic Wonder’. On view at the gallery Joseph Wales in Margate, this exhibition debuts a cycle of new paintings by Rook, experimenting with surreal narratives that unfold intuitively on the canvas, depicting bodies, animals, and hybrids in dream-like scenarios and disorienting spatial compositions. He reimagines fragments extracted from his inner life whilst envisioning worlds within worlds that bear uncanny resemblance to our own.
Rook’s psychologically layered, deliberately enigmatic works blur reality and fiction, past and present. His paintings operate through symbolism and analogy. Images hint, echo, and stand in for emotional states. Extending the language of the picture beyond the canvas, Rook also constructs the frames himself, treating them as an integral part of the work. At times, three-dimensional elements emerge within or from the painted surface, heightening the sense of liminal space and deepening the work’s shadowed melancholia, as if each scene is suspended in a transitory, dreamlike psychical state.
Socials:
Instagram: @kieranrookk
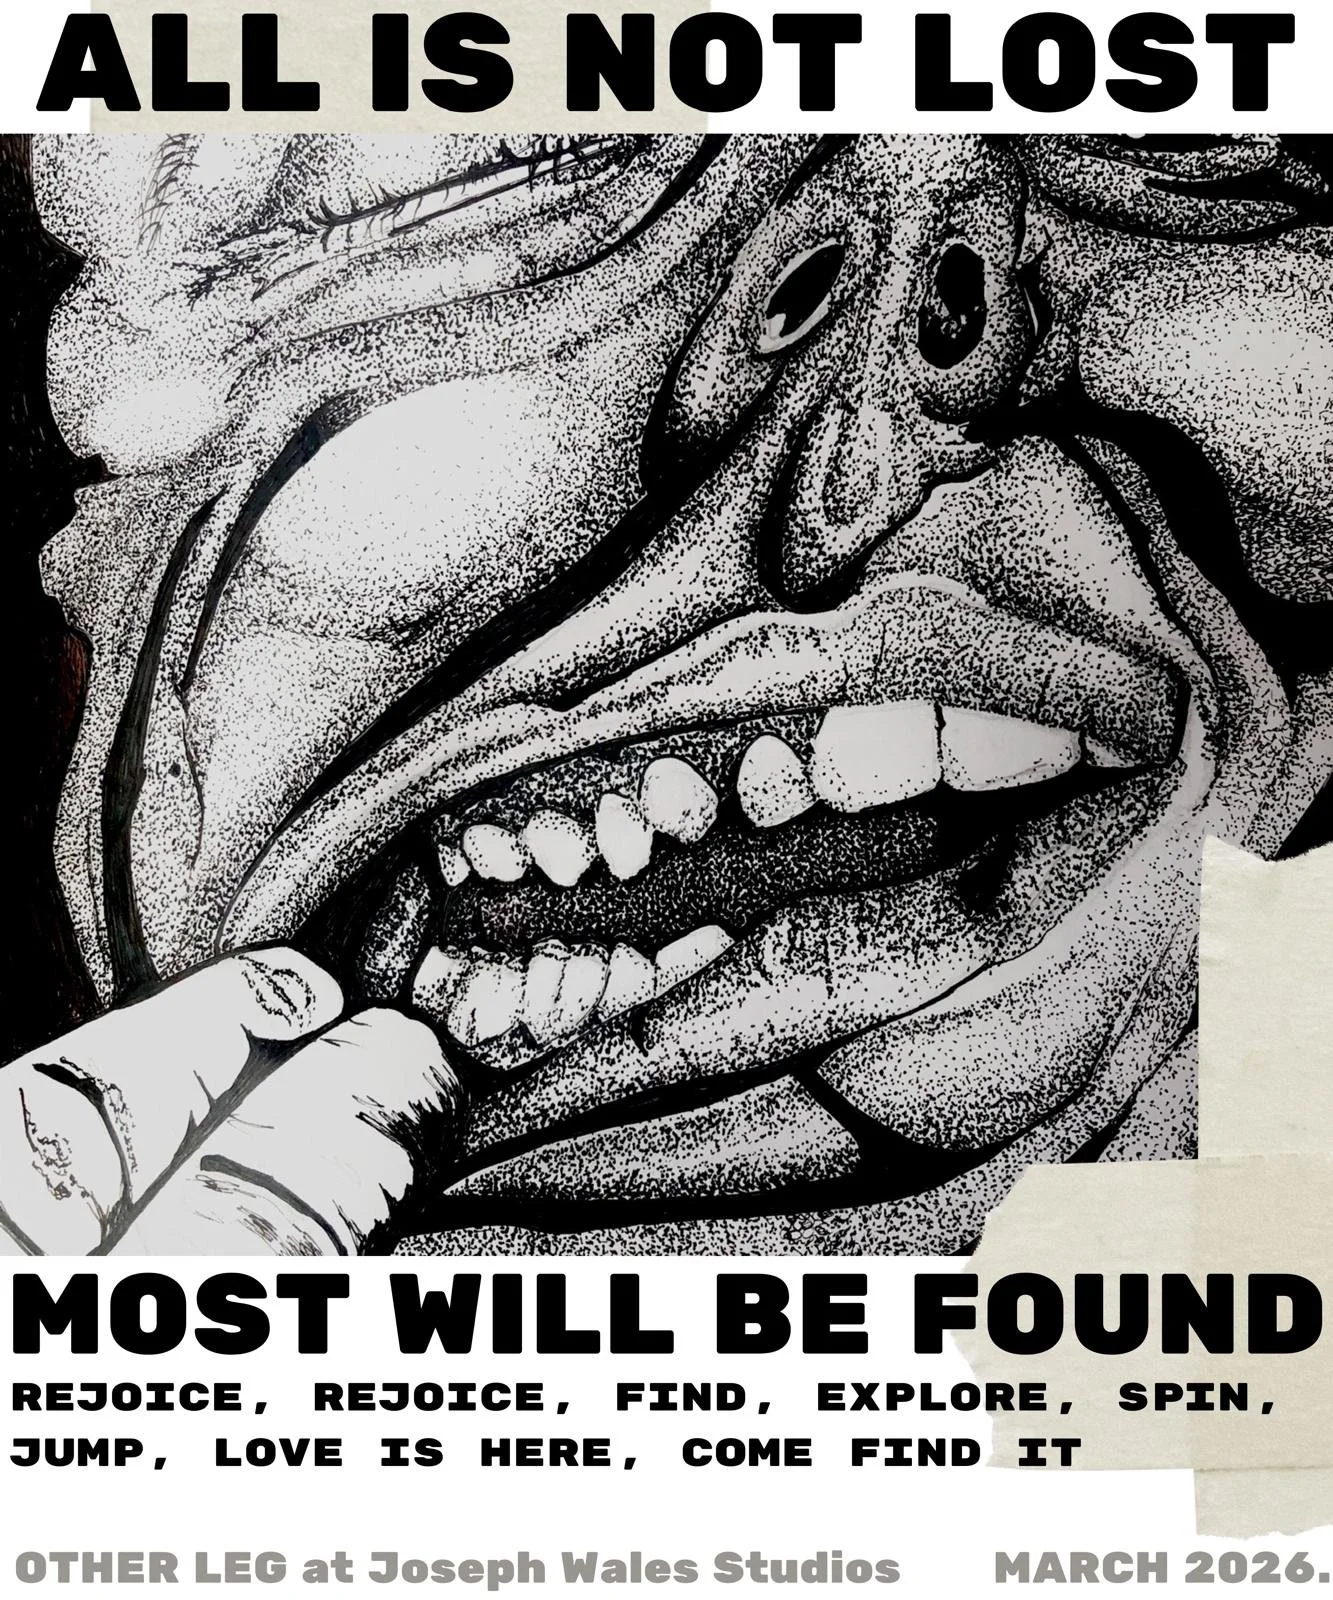
ALL IS NOT LOST, MOST WILL BE FOUND
March 2026
Rejoice, rejoice! Find, explore, spin, jump, love is here, come find it. Join Ellie Graham (of Other Leg) at the “All is not lost, most will be found” exhibition, where a series of abstract illustrations and storytelling panels will shed light on the beauty of life and love, reconnecting us to childlike whimsy and curiosity. Interact with a series of multimedia pieces that welcome playfulness - for all is not lost.
Socials:
Instagram: @other.leg
Website: otherleg.org
SHUFFLE
2nd April - 6th April 2026 | 11am-5pm
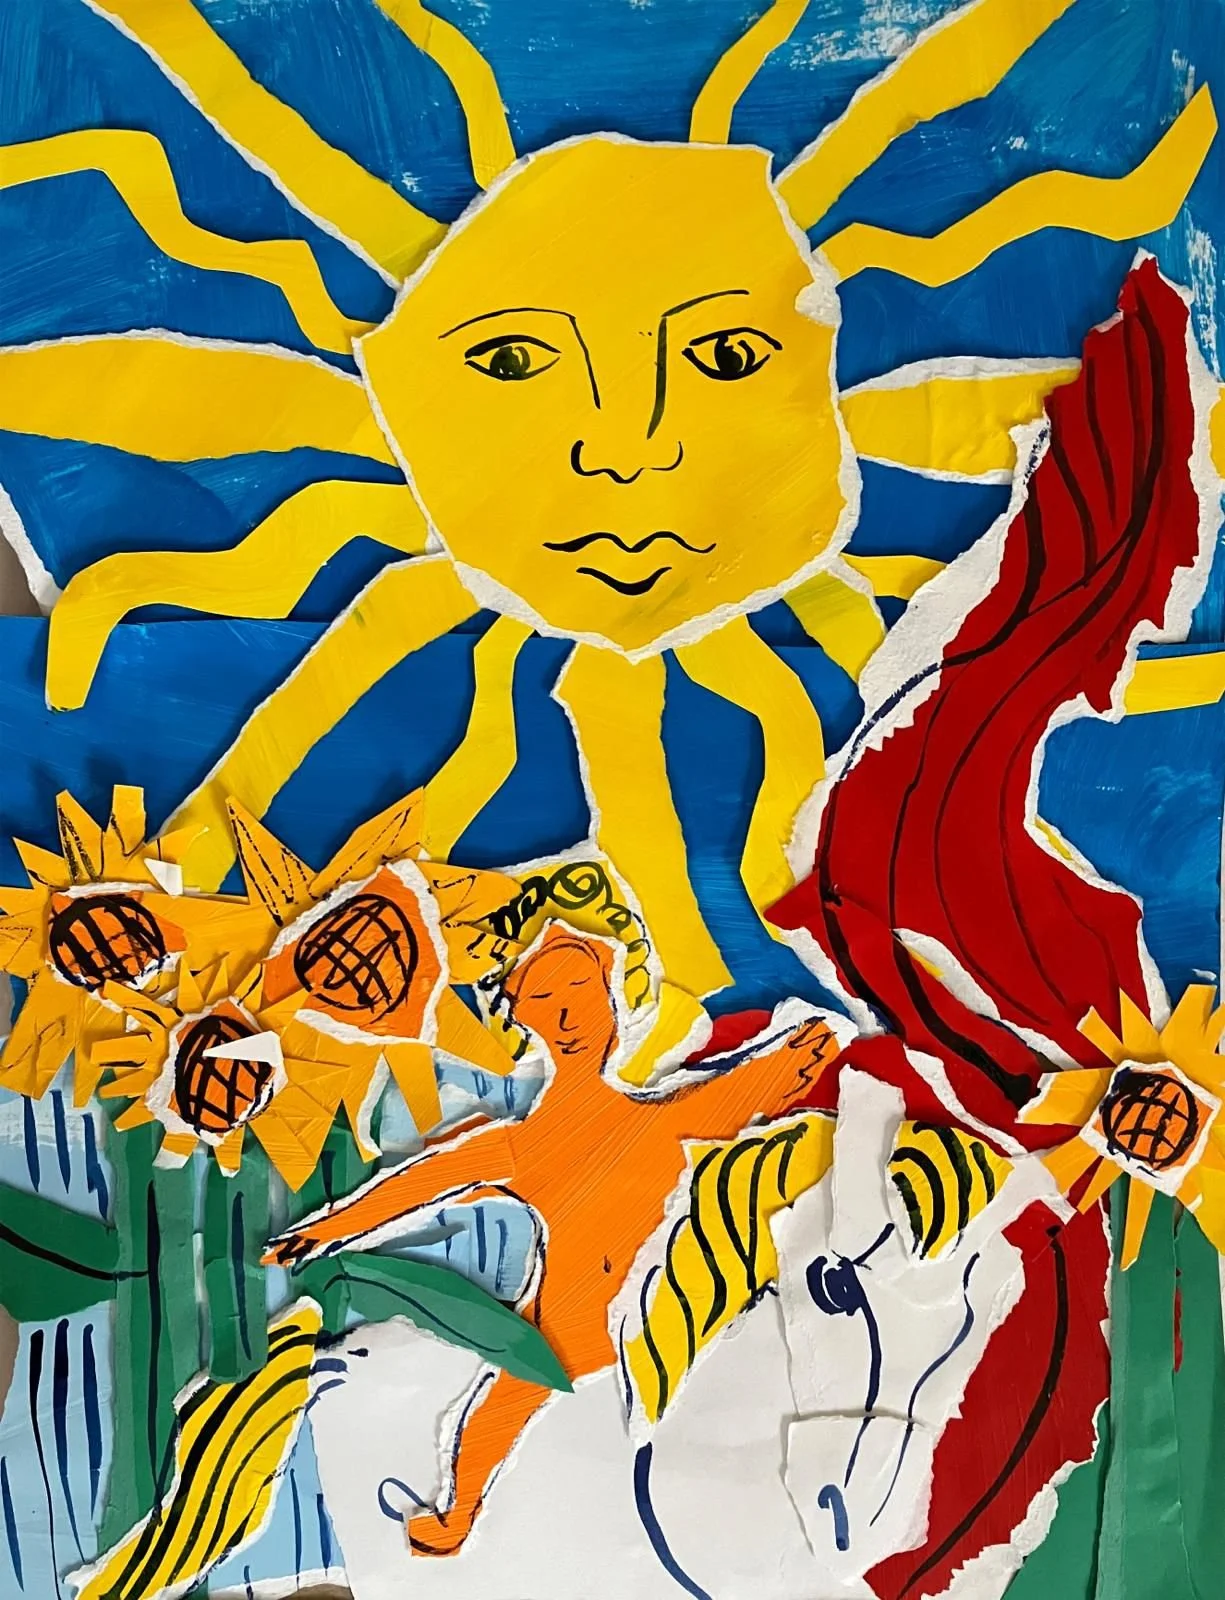
This new body of work sees Megan using the 22 cards of the Major Arcana as her starting point. Rooted in process and play, each piece is built from hand-painted paper, which she cuts, layers, and illustrates directly onto the surface through collage.
From The Magician to The World, the works draw on tarot imagery while opening it up to chance and reinterpretation.
The physical act of collage — tearing, shifting, and reassembling — reflects the way we intuitively piece together meaning in our own lives.
Like a shuffled deck, these works embrace uncertainty, transformation, and the quiet logic that can emerge when things are allowed to fall into place.
Private view on 2nd April at 5:30pm - 7:30pm
Socials:
Website: www.meganmetcalfstudio.com
Instagram: @meganmetcalfstudio


